Have you ever wondered exactly where your website visitors focus their attention? Or why some parts of your page get more clicks than others?
That’s where AI heat map technology steps in to give you clear, visual answers. This powerful tool uses smart algorithms to create color-coded maps that show the hotspots of user activity—without requiring you to dive into complicated coding or guesswork.
By understanding these attention patterns, you can make smarter decisions to improve your website’s design, boost engagement, and ultimately grow your business. Keep reading, and you’ll discover how AI heat maps work, why they matter, and how you can use them to unlock your website’s full potential.
Ai Heat Map Basics
AI heat map technology helps visualize data using colors. It shows which areas attract the most attention or activity. This makes it easier to understand complex information quickly.
AI heat maps use smart algorithms to analyze patterns and highlight key spots. You can see where users focus, click, or scroll on websites. This insight helps improve design and user experience.
Color-coded Data Visualization
AI heat maps use colors to represent data intensity. Warm colors like red show high activity. Cool colors like blue show low activity. This color code helps you spot trends fast. It makes large data sets easy to read and understand.
Attention Hotspots
Attention hotspots are areas where users focus most. AI heat maps reveal these hotspots clearly. They show which parts of a webpage catch the eye first. This helps improve content placement and design. Businesses can boost engagement by focusing on hotspots.
No Coding Required
Using AI heat map tools does not need coding skills. Most tools offer simple interfaces for easy use. You just upload your data or screenshots. The AI then generates the heat map automatically. This makes data analysis accessible to everyone.

Credit: www.drhandel.com
Core Functions
AI heat map technology serves several core functions that help businesses and researchers make sense of complex data. It transforms raw data into visual insights, making interpretation fast and simple. These functions focus on showing data intensity, tracking user actions, detecting trends, and aiding smart decisions.
Visualizing Data Intensity
This function uses colors to represent the strength or frequency of data points. Warmer colors like red show areas with high activity or concentration. Cooler colors like blue indicate low activity or absence. This visual guide helps users quickly spot hotspots and cold zones in any dataset.
Tracking User Behavior
AI heat maps monitor how users interact with websites or apps. They capture clicks, scrolls, and mouse movements. This data reveals what grabs attention and what is ignored. Businesses use this insight to improve user experience and increase engagement.
Spotting Patterns And Trends
Heat maps highlight recurring behaviors or shifts over time. They uncover hidden relationships and unusual data points. This makes it easier to detect trends that may impact business or research outcomes. Patterns become clear without sifting through raw numbers.
Supporting Decision-making
By providing clear visual data, AI heat maps help decision-makers act confidently. They simplify complex information into understandable visuals. Teams can optimize designs, marketing strategies, and resource allocation based on these insights. This reduces guesswork and improves results.
Common Uses
AI heat map technology finds many uses across different fields. It helps visualize where attention or activity is highest. This makes it easier to understand complex data quickly. Here are some common uses of AI heat maps in real-world scenarios.
Website Analytics
AI heat maps show where visitors click and scroll on websites. They highlight popular sections and ignored areas. This data helps improve website design and user experience. Marketers use it to boost engagement and conversions.
Business Intelligence
Businesses use AI heat maps to analyze sales and customer data. They track patterns across regions or stores. This insight supports smarter decisions about marketing and resource allocation. It also helps spot new opportunities.
Retail Foot Traffic
Retail stores use AI heat maps to study customer movement inside shops. The maps reveal hot spots and bottlenecks. This helps optimize store layouts and product placement. It aims to increase sales and improve shopper comfort.
Sports Strategy
Sports teams analyze player movement and game patterns with AI heat maps. Coaches use this data to develop better strategies. It highlights strengths and weaknesses on the field. Teams can plan tactics based on real performance insights.
Healthcare Insights
Healthcare providers apply AI heat maps to track patient flow and resource use. They identify crowded areas and peak times. This helps improve hospital management and patient care. Researchers also study medical images using heat maps for better diagnosis.
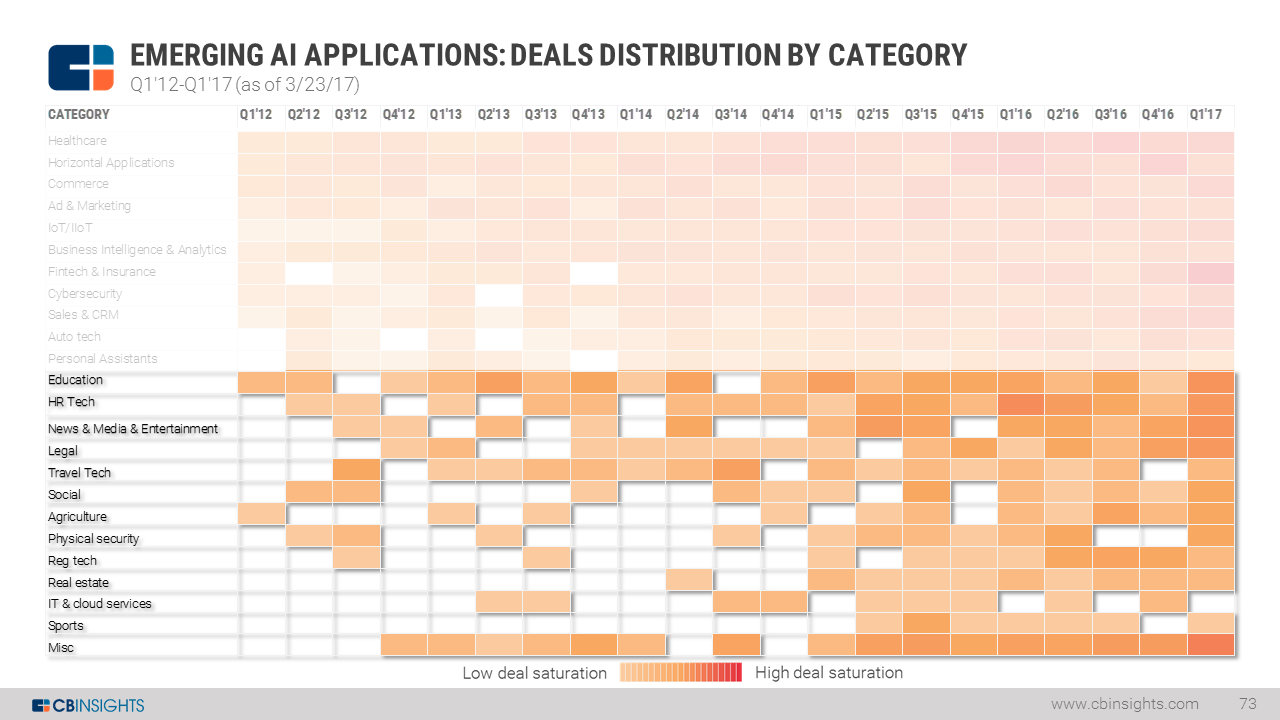
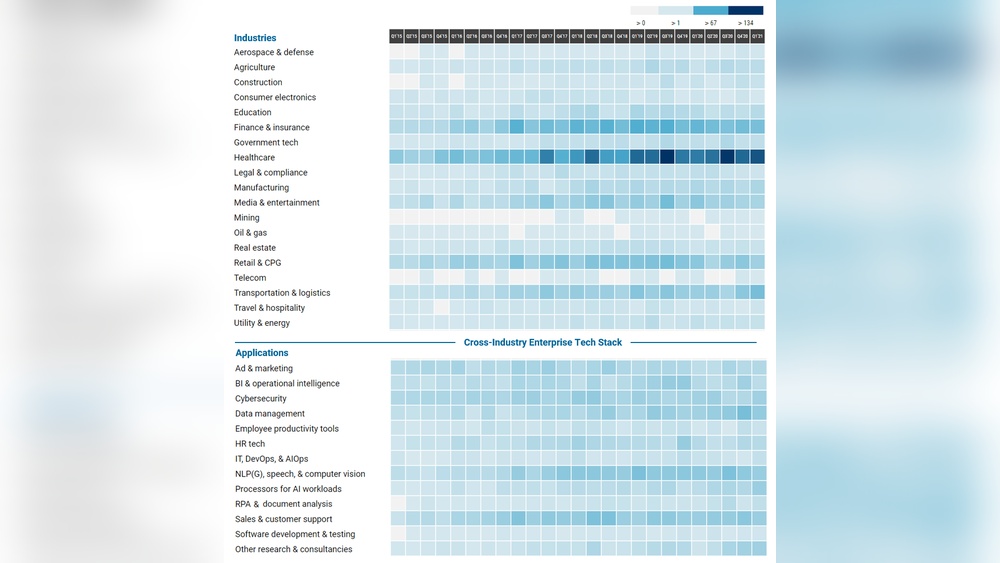
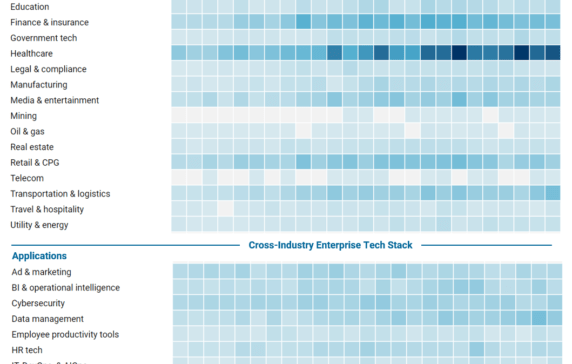
Credit: www.cbinsights.com
Benefits Of Ai Heat Maps
AI heat maps offer clear benefits for businesses and website owners. They turn complex data into simple visuals. This helps teams make better decisions quickly. The technology highlights key areas of user interest and behavior. This insight leads to smarter design, marketing, and user engagement.
Faster Insight Generation
AI heat maps analyze user data instantly. They show where visitors click and scroll the most. This speeds up understanding of user behavior. Teams can quickly spot problems or popular areas. Fast insights reduce the time spent on guesswork.
Improved User Experience
Heat maps reveal how users interact with a website. This helps identify confusing or ignored sections. Businesses can fix these issues to keep visitors engaged. A smoother experience increases user satisfaction and retention.
Enhanced Marketing Strategies
Marketers use AI heat maps to see what attracts attention. They learn which parts of a page drive clicks and conversions. This data guides ad placement and content focus. Marketing campaigns become more effective and targeted.
Data-driven Design
Designers rely on heat maps to test layouts and elements. They see what works and what does not. Changes are based on real user data, not opinions. This leads to more appealing and functional websites.
How Ai Enhances Heat Maps
AI heat map technology changes how we understand data visually. It improves heat maps by making them smarter and faster. AI adds deep learning and data analysis to simple color patterns. This helps businesses and researchers get clearer insights from complex information.
AI enhances heat maps in several key ways. It finds hidden patterns, updates data instantly, and manages huge amounts of information. These improvements make heat maps more accurate and useful.
Pattern Recognition
AI can spot trends and patterns that humans often miss. It learns from data and highlights important areas automatically. This skill helps reveal user behavior or data clusters quickly. Businesses can see what parts attract the most attention or cause issues. Pattern recognition makes heat maps smarter and more insightful.
Real-time Data Updates
AI processes data as it comes in, creating live heat maps. This means the map changes instantly with new information. Users get up-to-date insights without waiting. Real-time updates help monitor events or user actions as they happen. This feature is valuable for fast decision-making and tracking.
Handling Large Datasets
AI works well with huge data sets that are hard to manage manually. It sorts and analyzes massive amounts quickly and accurately. This ability allows heat maps to cover more data points and details. Handling large data improves accuracy and reveals deeper insights. AI makes complex data easy to understand visually.
Credit: www.cbinsights.com
Implementing Ai Heat Maps
Implementing AI heat maps helps businesses see how users interact with websites. These visual tools show where visitors focus most, revealing areas needing improvement. Using AI heat maps can improve design and user experience by highlighting key attention points.
Careful setup and interpretation ensure the technology provides clear, useful insights. Choosing the right tools and integrating them properly allows for smooth data collection and analysis. Understanding the results helps in making informed decisions to boost engagement and conversions.
Tools And Platforms
Many tools offer AI heat map technology for website analysis. Popular platforms include Hotjar, Crazy Egg, and Microsoft Clarity. These tools track clicks, scrolls, and mouse movements automatically. Some provide AI-powered predictions based on visitor behavior. Choosing a tool depends on budget, features, and ease of use.
Integration Tips
Start by adding the heat map tool’s code snippet to your website. Ensure it loads quickly without slowing the site. Test on different pages to verify data collection. Regularly update the tool for new features and security. Combine heat maps with analytics tools for a complete view. Keep visitor privacy in mind and comply with regulations.
Interpreting Results
Heat maps use colors to show visitor attention levels. Red areas indicate high engagement, blue shows low. Look for hotspots on important buttons or links. Cold spots may show confusion or lack of interest. Use insights to adjust layout, text, or images. Track changes over time to measure improvements.
Challenges And Considerations
AI heat map technology offers valuable insights but faces several challenges. Understanding these issues helps users apply the technology wisely. Awareness of limitations ensures better decisions and realistic expectations.
Data Privacy
AI heat maps often collect user interaction data. Protecting this data is critical to avoid privacy breaches. Users must comply with privacy laws and regulations. Anonymizing data helps reduce risks. Transparency about data use builds trust with users.
Accuracy Limits
AI models can make mistakes interpreting heat map data. Results depend on the quality and quantity of input data. Poor data can lead to misleading conclusions. Heat maps show general trends, not exact behaviors. Human review is essential to validate AI findings.
Overreliance On Visuals
Heat maps provide visual summaries, which may oversimplify complex data. Users might ignore deeper analysis or context. Visual cues can bias decision-making if treated as absolute truth. Combining heat maps with other tools gives a fuller picture. Balance visuals with critical thinking for best results.
Frequently Asked Questions
What Is An Ai Heatmap?
An AI heatmap visually displays user attention on a webpage using color-coded areas. It predicts hotspots without coding, helping optimize design and engagement.
What Is The Main Purpose Of A Heatmap?
A heatmap visually displays data intensity using colors to highlight user behavior, patterns, and trends. It helps optimize websites, marketing, and decision-making.
What Are Ai Maps Used For?
AI maps visualize data patterns using color codes to reveal hotspots, user behavior, trends, and optimize decisions in marketing and design.
Can Chatgpt Create Heatmaps?
ChatGPT cannot directly create heatmaps. It can generate code or guide you to use tools that produce heatmaps.
Conclusion
AI heat map technology helps visualize data clearly and simply. It shows where users focus most on websites or apps. This insight guides better design and marketing choices. Businesses can spot trends and fix issues fast. Using AI heat maps improves user experience and decision-making.
Understanding this tool can boost your digital success.